Parameterized Quarto reports improve understanding of soil health


Jadey Ryan
Molly McIlquham, Kwabena Sarpong, Leslie Michel,
Teal Potter, Deirdre Griffin LaHue, Dani Gelardi

posit::conf(2023) | September 20

Don’t care about soils?

Parameterized reporting is for everyone!

Why should you listen to me?

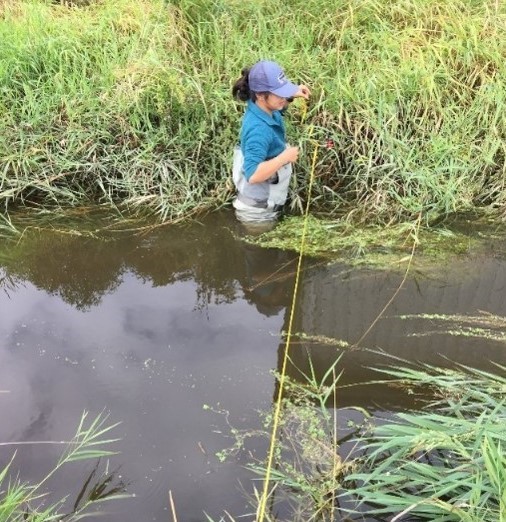
Hired as an environmental technician.

Jadey in waders setting up a transect with a measuring tape to measure flow in a small stream.

Then transitioned to data scientist.

Jadey's cat, Mai, sitting on her laptop that has RStudio open. The monitor next to the laptop and cat has the R Packages book by Hadley Wickham and Jenny Bryan open.

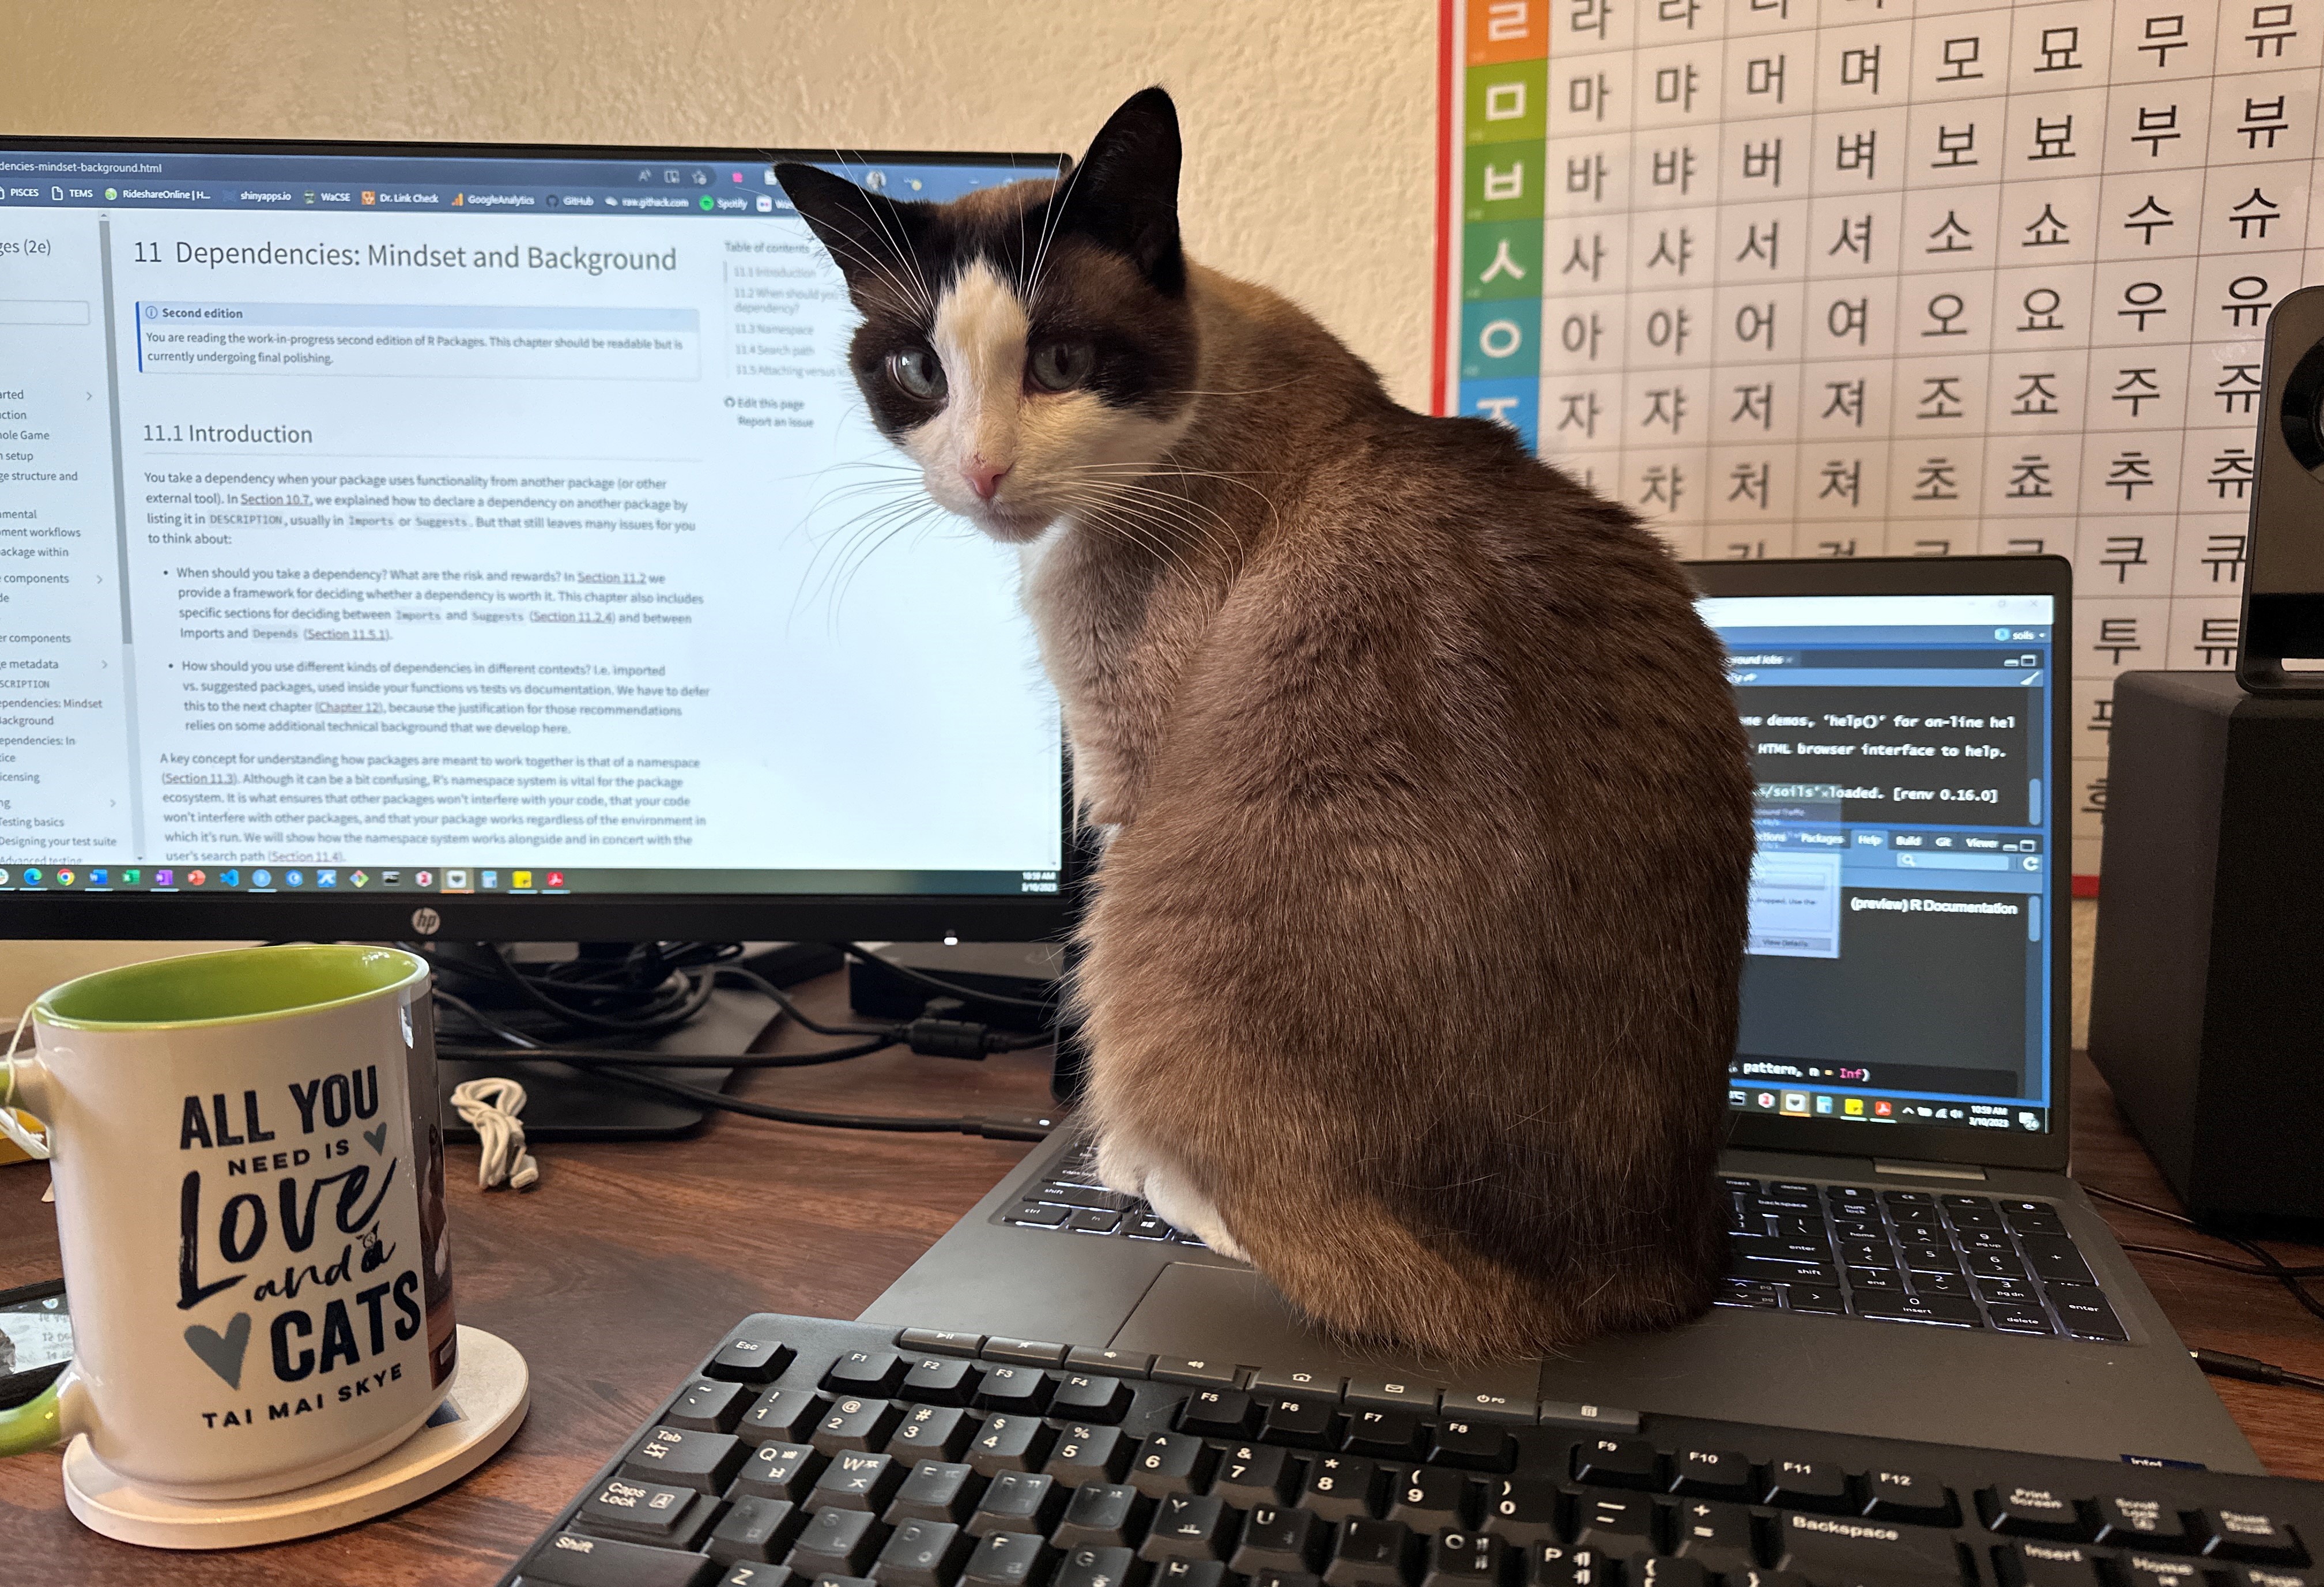
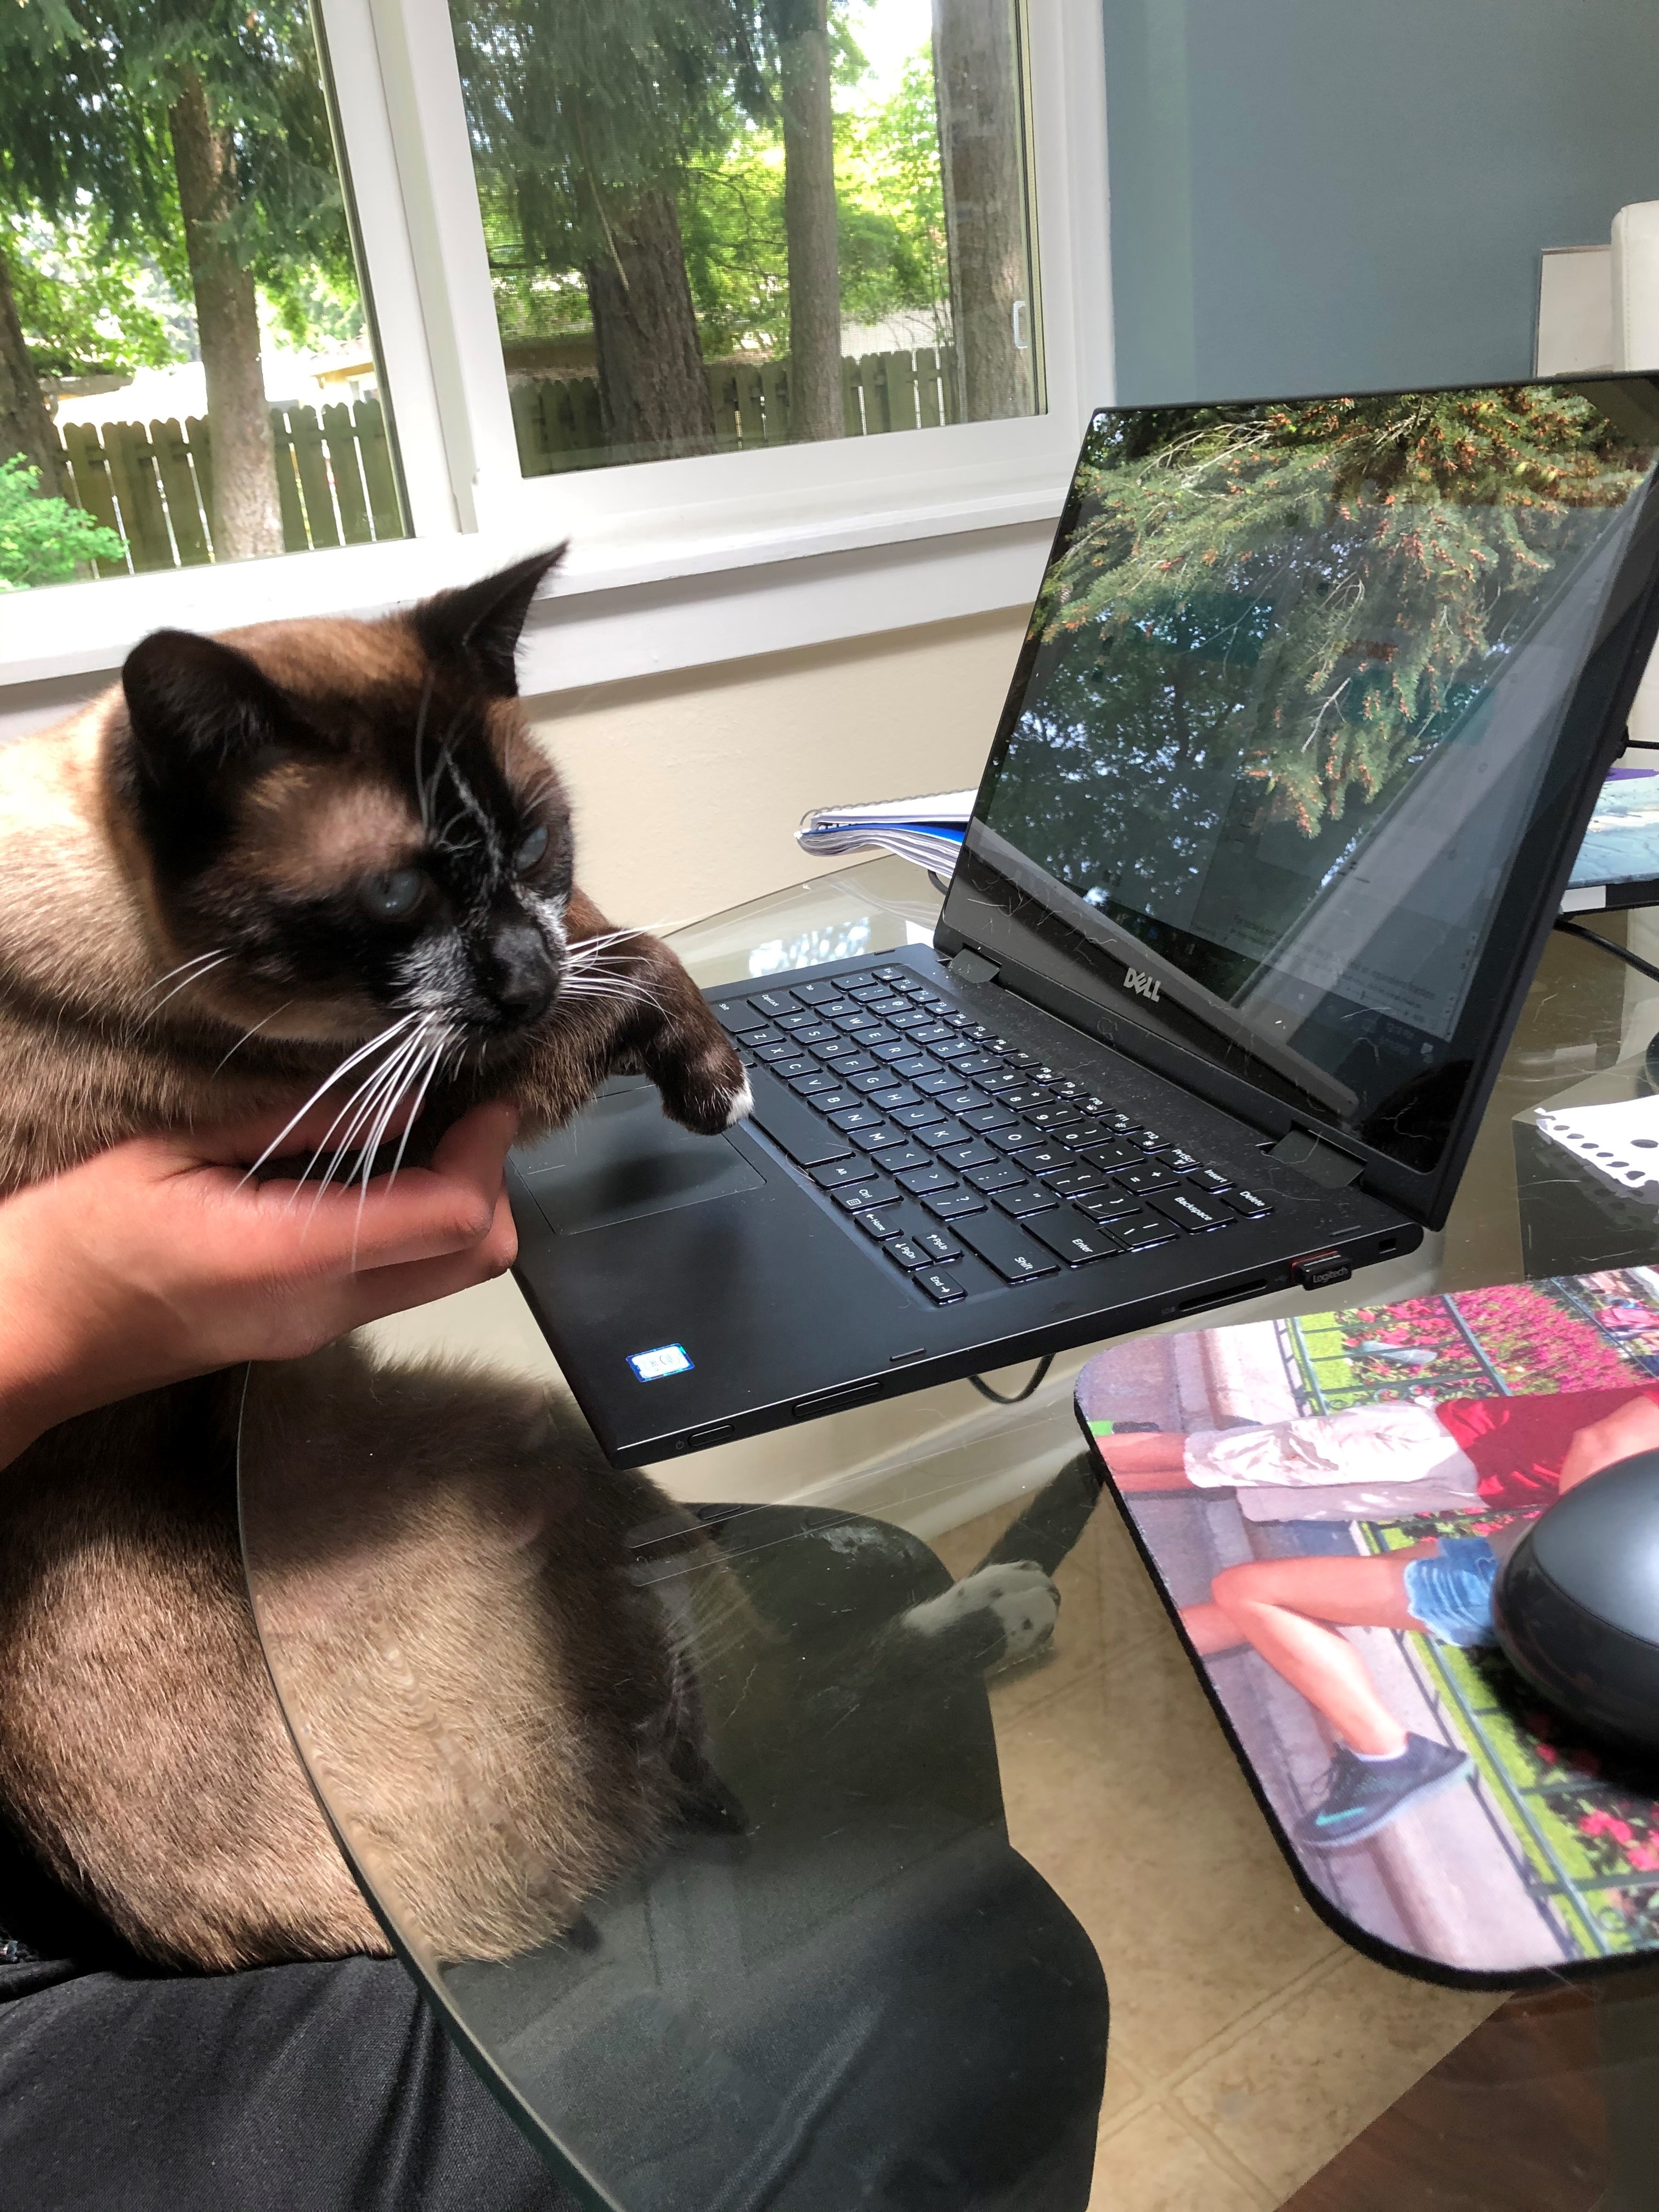
I went from picking leeches off my boots to picking cats off my keyboard!

How did I go from a ‘non-coder’ to a data scientist?

With a skills test!

Task: generate custom Soil Health Reports for each individual farmer


Timeframe: one week


Challenge: how do I automate custom reports???

Cat with an expression of existential dread

YouTube and blog rabbit holes & tutorial hell…

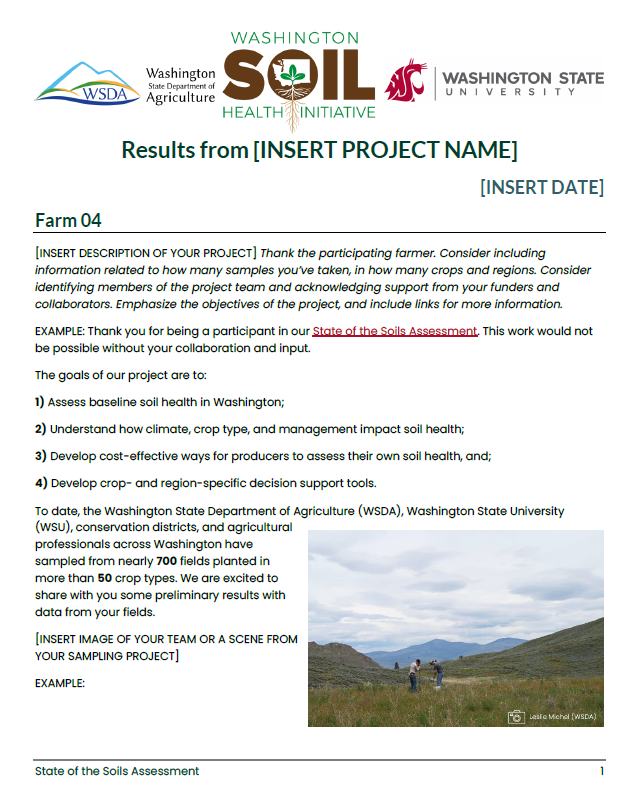
2021: the reports that got me my job

Cover page of 2021 report with project summary

Example 2021 report with box plots

2023: new HTML reports with Quarto!

Beginning of 2023 example HTML report

and MS Word to PDF

…because LaTeX 😖 🤷

First page of 2023 example MS Word report

Page from example MS Word report showing soil texture triangle

Code snippets and 7 pages of resources

We’re end-of-conference tired 🥱 and our brains are full 😵.

Don’t worry about taking notes or copying code.

QR code to slides.

Slides at tinyurl.com/quarto-params

Workflow

Flow chart of workflow: Learn about parameterized reports, prepare subsettable data, create content for easy consumption, design for accessibility.

Parameterized Quarto reports work with both Knitr and Jupyter engines.

Cat typing on laptop.

— Step 1 —
Learn about parameterized reports

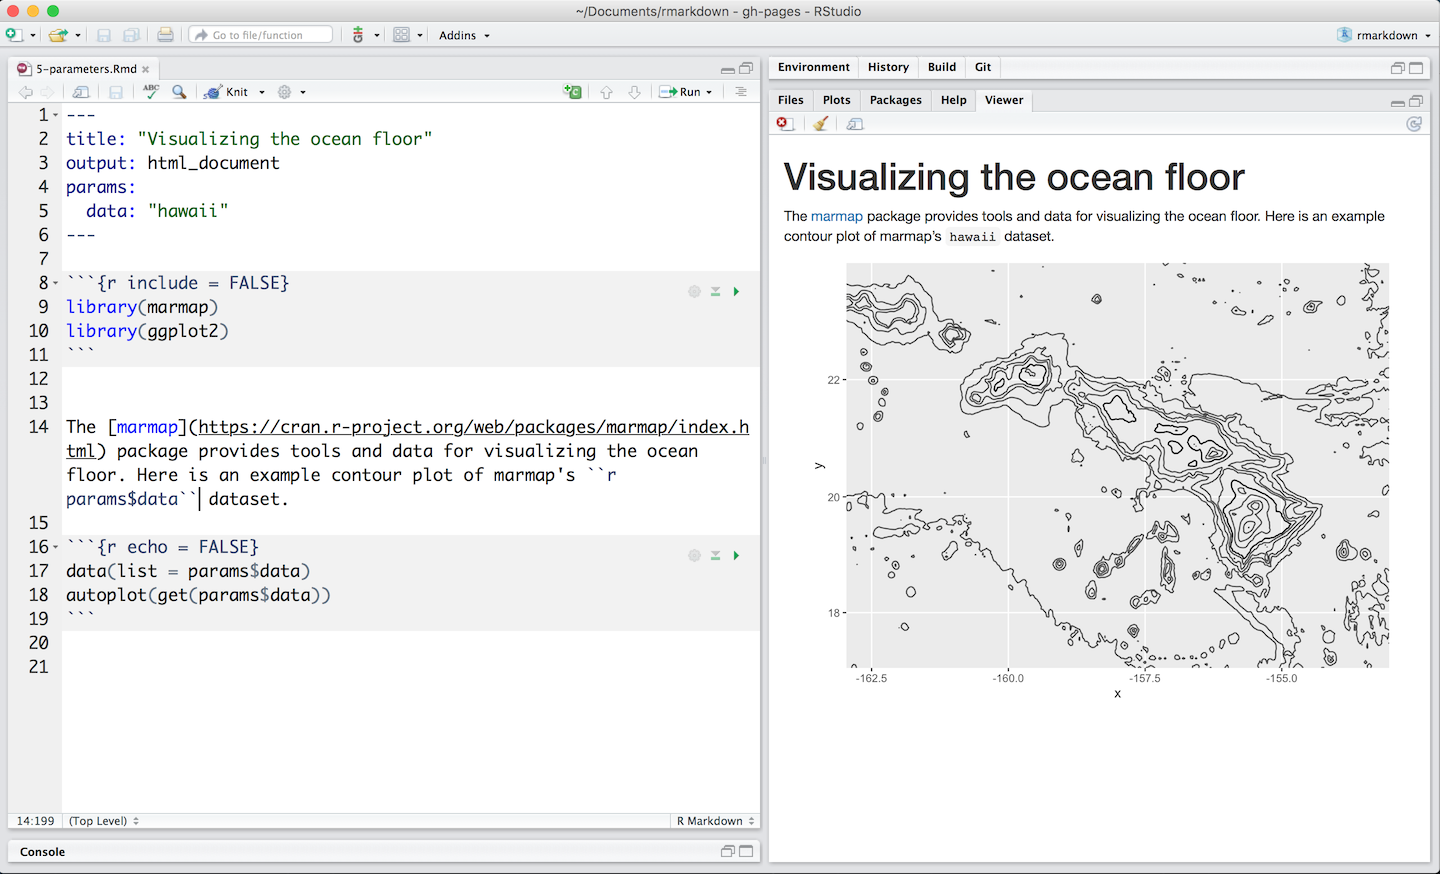
What are parameterized reports?

File with the word '.qmd' inside and the word 'Function' above.

An arrow points from 'Input' with 'params$year' to the previous image with 'Function' and '.qmd' file.

In addition to the previous two images, arrows point to five reports with years 2019 through 2023 on them in a flow chart.

YAML Header: Yet Another Markdown Language

---
title: "Soil Health Report"         # Metadata
format:                             # Set format types
  html:                                     
  docx:                            
params:                             # Set default parameter key-value pairs
  farmer: Sammy Sunflower                   
  year: 2023                                
---
    
Report content goes here.           # Write content

Access your parameters

Run any line or chunk to add params to your environment.

params object is a list.

str(params)
List of 2
 $ farmer: chr "Sammy Sunflower"
 $ year  : num 2023

Access with $ notation.

params$farmer
[1] "Sammy Sunflower"

For inline code, enclose the expression in `r `.

These are results for `r params$farmer`.

These are results for Sammy Sunflower.

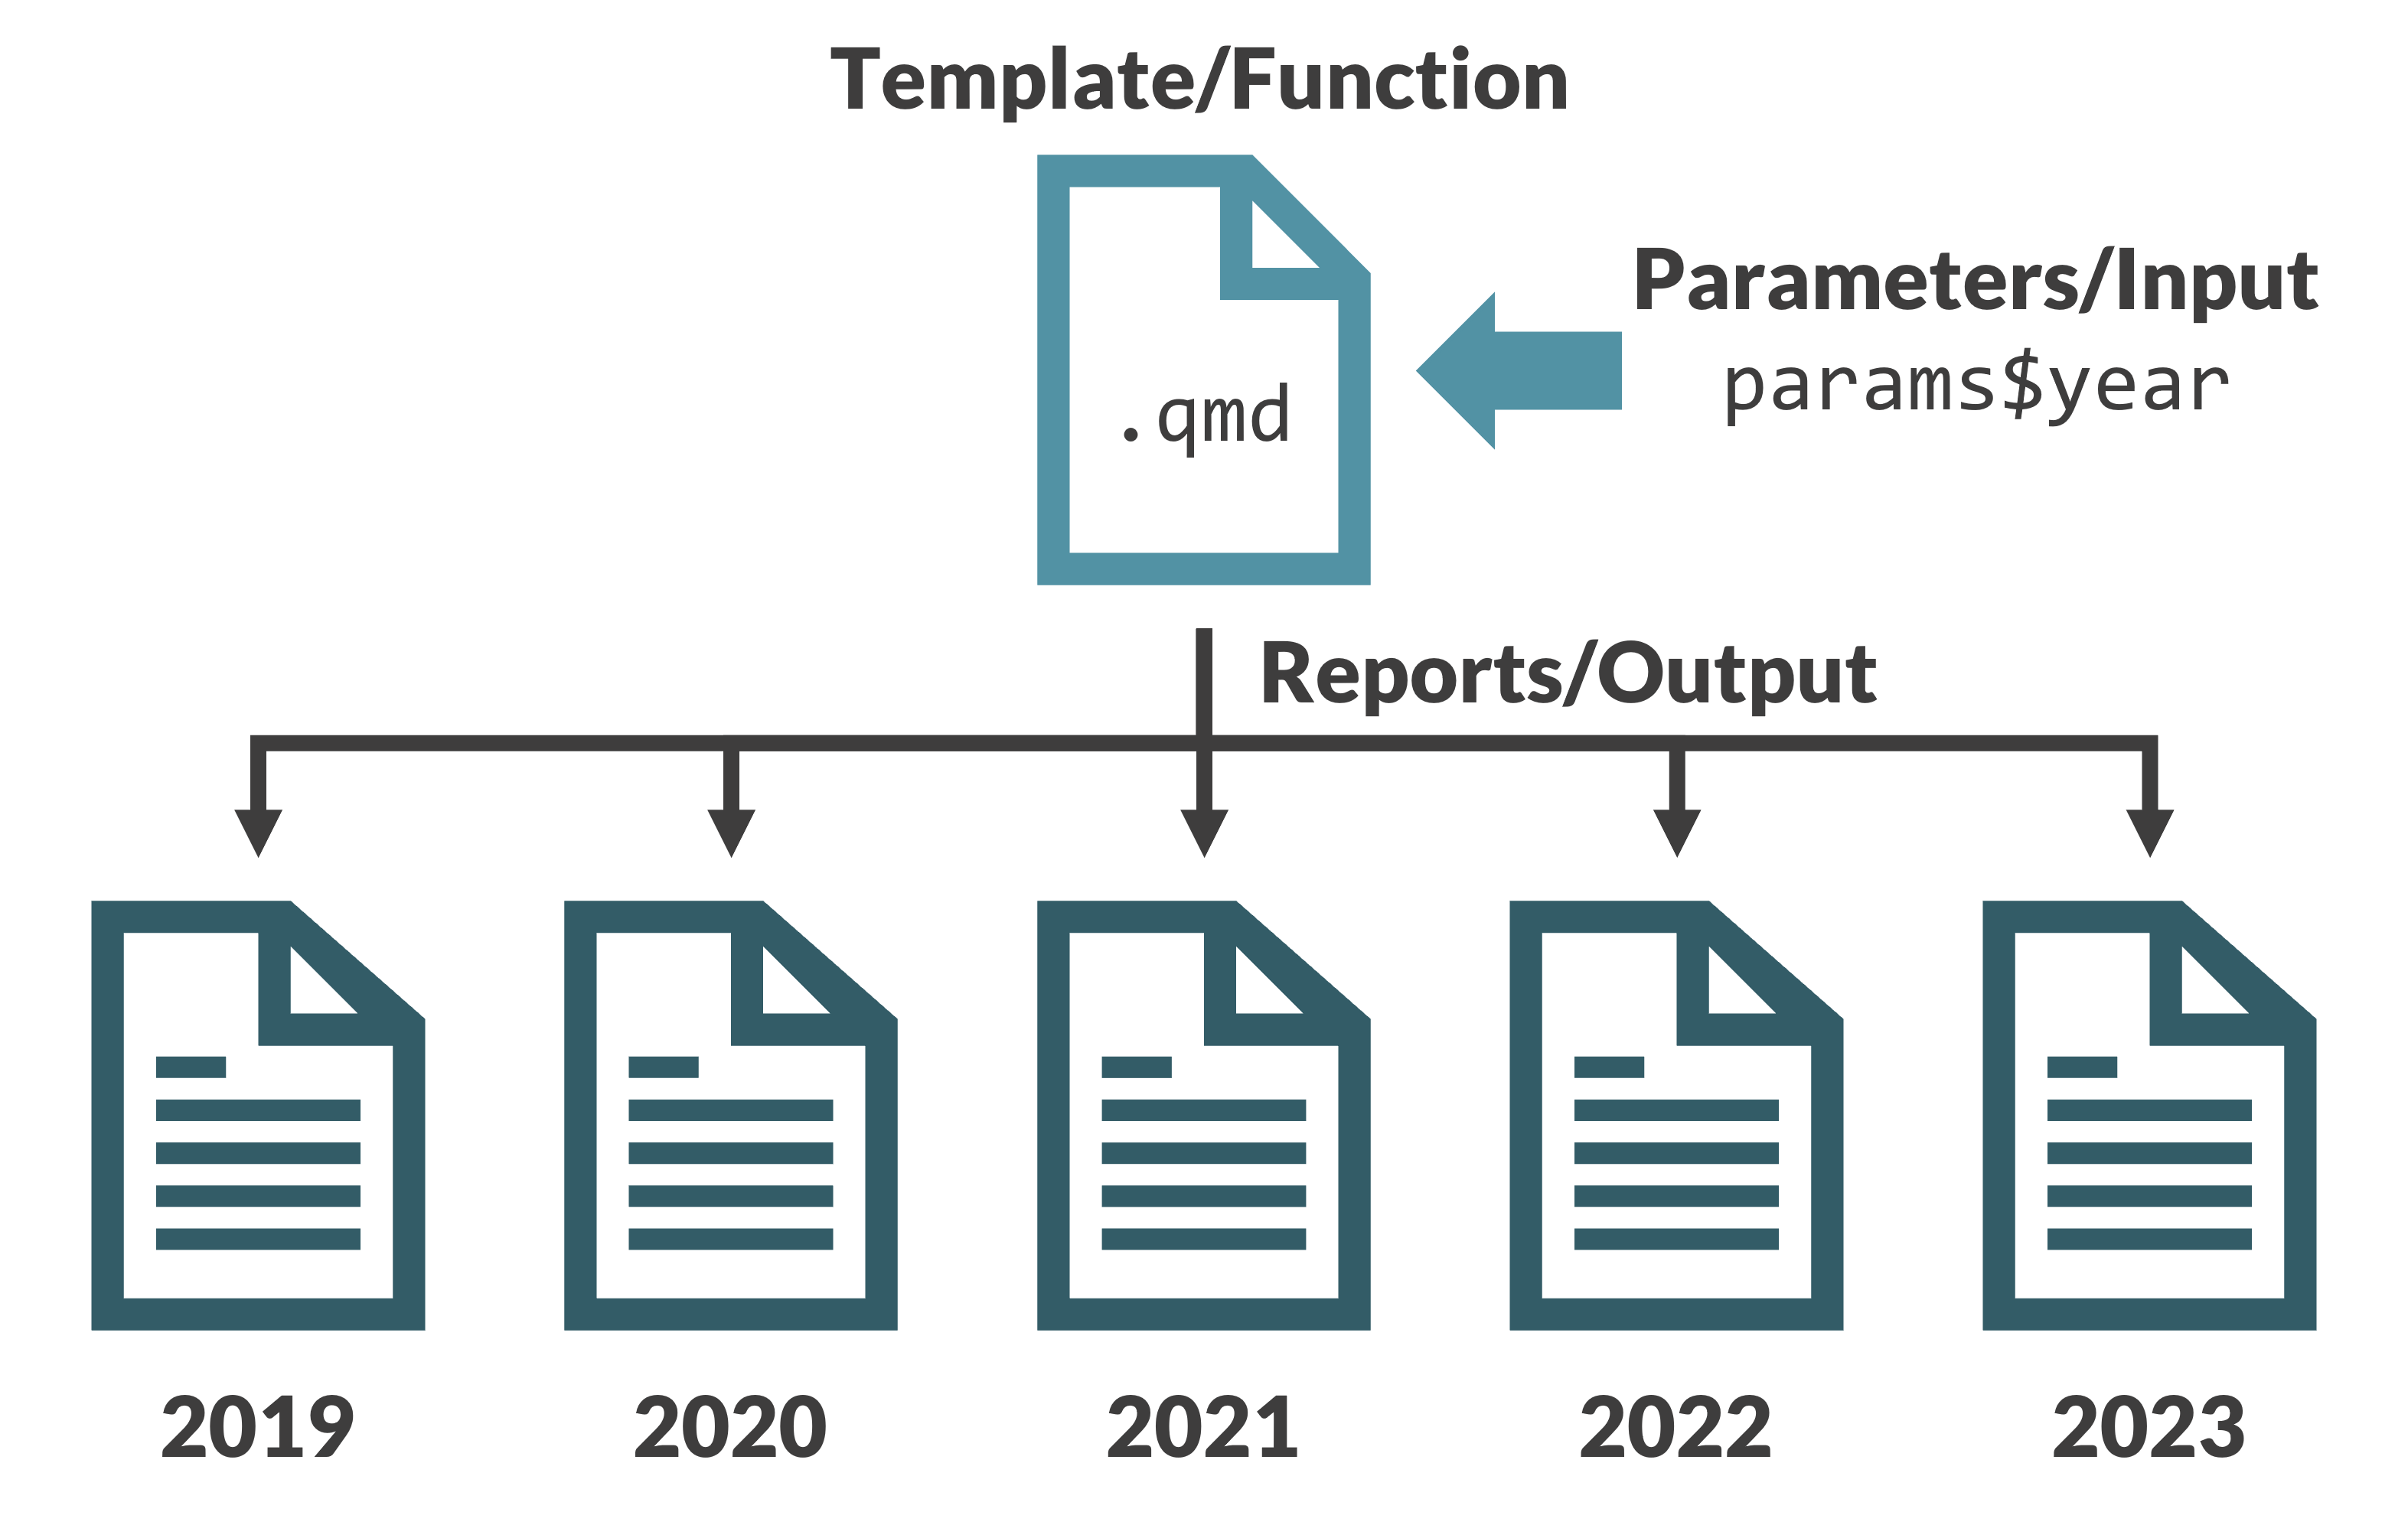
Render with the RStudio IDE

RStudio Quarto Render button with a dropdown for HTML and MS Word with Render on Save option checked

Render Button, keyboard shortcut Ctrl + Shift + K, or by saving.

Uses default parameters in the YAML.

Output file has same name and location as input file.

Render with quarto::quarto_render()

Use in Console or an iterate.R script.


quarto::quarto_render(
  input = "template.qmd",                           # Input Quarto file
  output_format = "html",                           # Output format
  output_file = "2022_OscarOrchard_Report.html",    # Output file name
  execute_params = list(                            # Named list of parameters
    farmer = "Oscar Orchard",
    year = 2022
  )

Render all reports at once

Create a data frame with two columns that match quarto_render() args:

  • output_file: filename.ext
  • execute_params: named list of parameters
Code
reports <- data |>
  dplyr::distinct(farmer, year) |>
  dplyr::mutate(
    output_file = paste0(
      year, "_", gsub(" ", "", farmer), "_Report.html"
    ),
    execute_params = purrr::map2(
      farmer, year,
      \(x, y) list(farmer = x, year = y)
    )
  ) |> 
  dplyr::select(output_file, execute_params)

head(reports, 3)
output_file execute_params
2023_SammySunflower_Report.html Sammy Sunflower, 2023
2022_OscarOrchard_Report.html Oscar Orchard, 2022
2022_TinaTomato_Report.html Tina Tomato, 2022

Render all reports at once

Map over each row of the reports dataframe.

reports |>
  purrr::pwalk(
    quarto::quarto_render,
    input = "template.qmd",
    output_format = "html"  
    )

Surprised cat next to the surprised Pikachu meme.

— Step 2 —
Prepare subsettable data

Our simple data

year sampleId farmer crop sand_% silt_% clay_%
2023 23-SUN-01 Sammy Sunflower Sunflower 44 23 3
2022 22-ORC-02 Oscar Orchard Cherry 69 21 10
2022 22-TOM-02 Tina Tomato Vegetable 11 79 10
2022 22-HAR-03 Henry Harvest Herb 36 51 13
2023 23-GAR-03 Grace Gardener Sunflower 64 33 3
2022 22-QUI-02 Quincy Quinoa Quinoa 24 62 14


fake farmer names: ChatGPT 🙏🏻

Use params to set up comparisons

data |> 
  dplyr::filter(farmer == params$farmer) |> 
  more data wrangling
Code
# Get the farmer's crops
farmer_crop <- data |>
  dplyr::filter(farmer == params$farmer) |>
  dplyr::pull(crop) |>
  unique()

data_long <- data |>
  # Tidy data: one observation per row
  tidyr::pivot_longer(cols = c("sand_%":"clay_%"),
                    names_to = "measurement") |> 
  dplyr::mutate(
    # Categorize samples based on if they are from the farmer of
    # interest or are of the same crop type
    category = dplyr::case_when(
      farmer == params$farmer ~ "Your fields",
      crop %in% farmer_crop ~ "Same crop",
      TRUE ~ "Other fields"
    )
  )

# Set category factor levels
data_long$category <- factor(
  data_long$category,
  levels = c("Other fields", "Same crop", "Your fields"),
  labels = c("Other fields", "Same crop", "Your fields")
)

data_long |> 
  dplyr::select(-c(year, sampleId)) |> 
  dplyr::slice_head(by = category) |> 
  kableExtra::kable() |> 
  kableExtra::column_spec(5, background = "#FDCE86")
farmer crop measurement value category
Sammy Sunflower Sunflower sand_% 44 Your fields
Oscar Orchard Cherry sand_% 69 Other fields
Grace Gardener Sunflower sand_% 64 Same crop

— Step 3 —
Create content for easy consumption

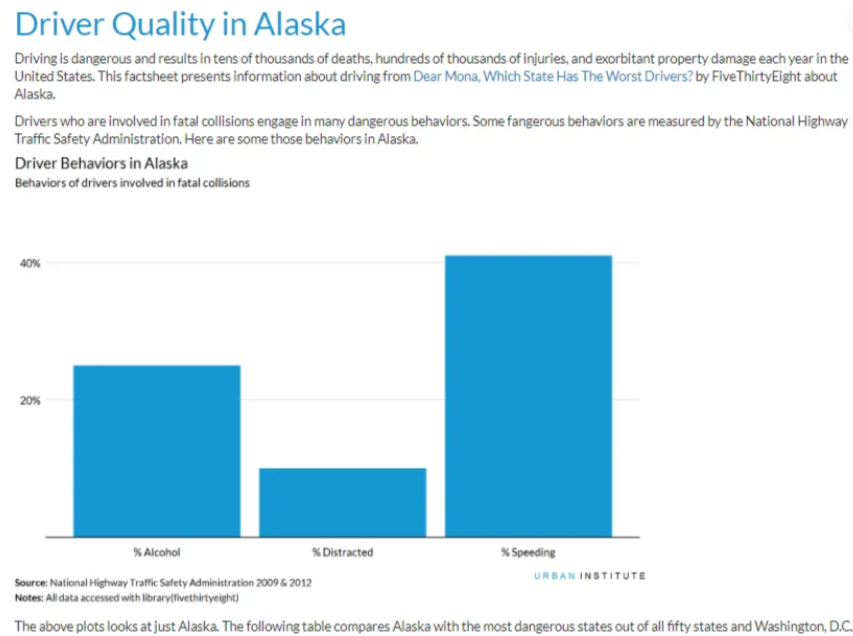
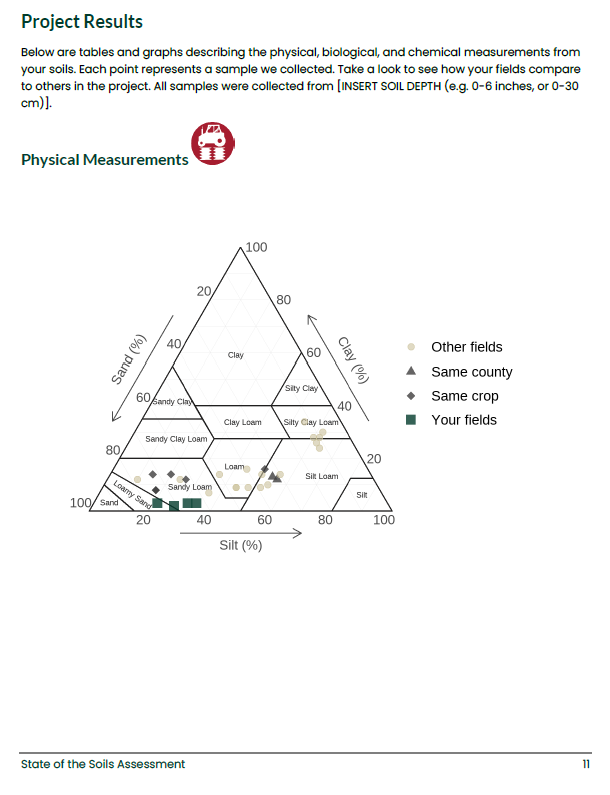
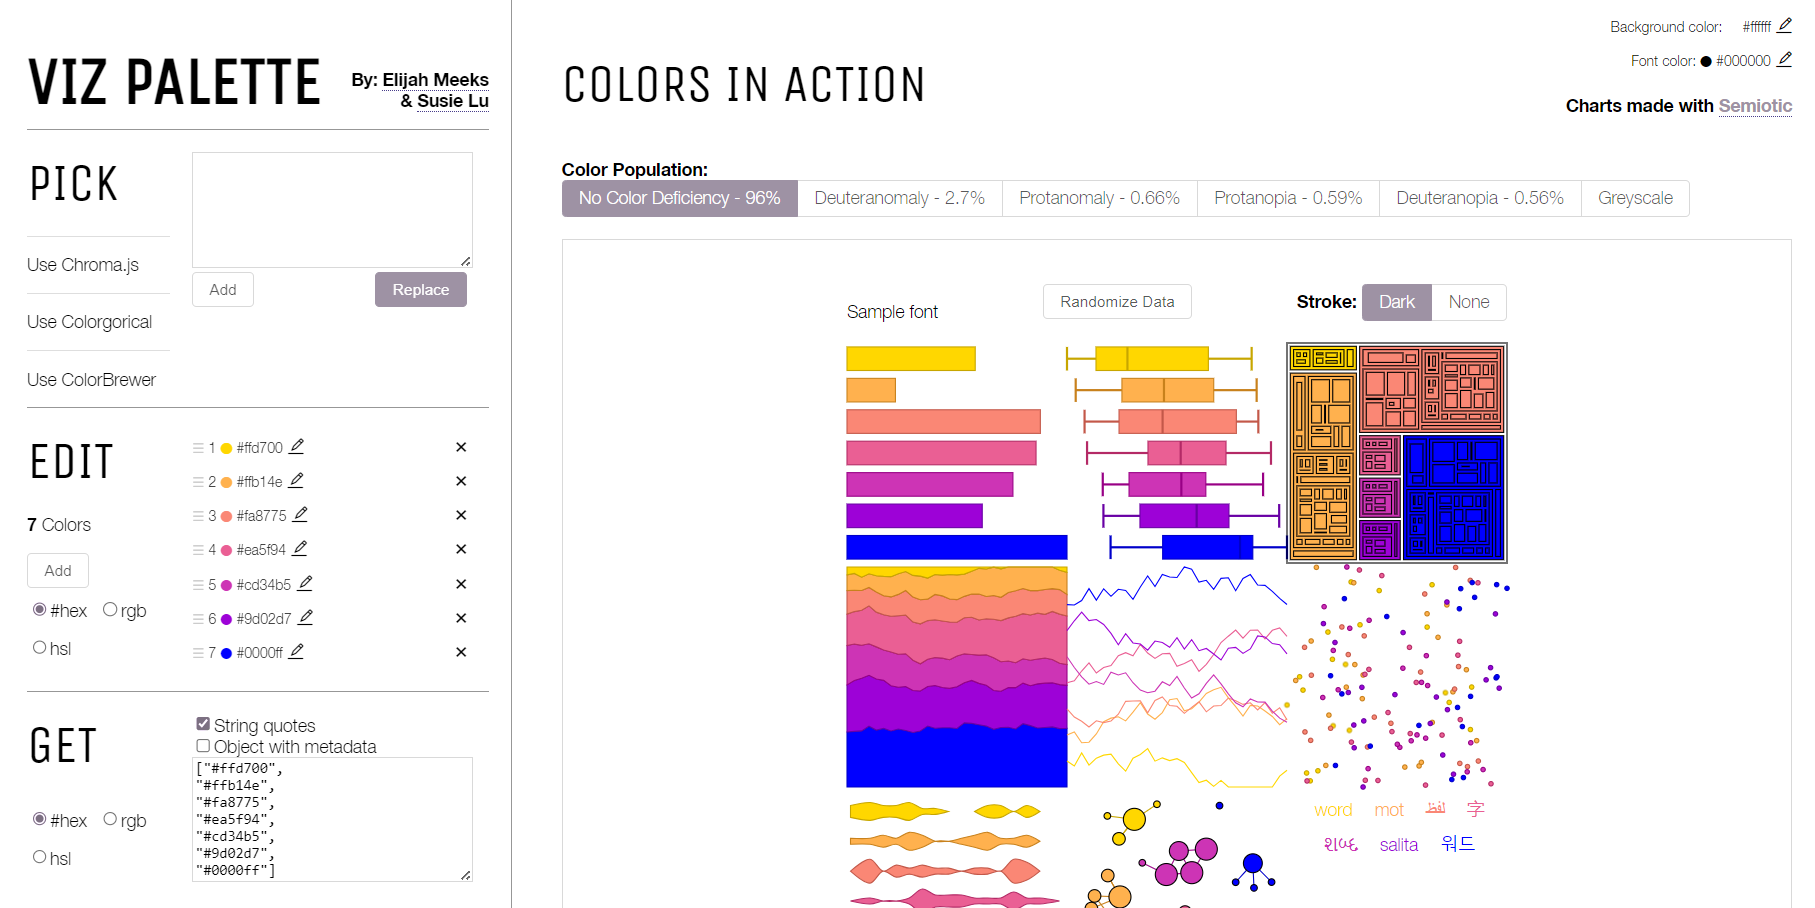
Interpretation through comparison

Show how their results compare to other samples in similar contexts.

Code
library(ggplot2)
set.seed(123)
data_long |>
  ggplot(aes(
    x = measurement,
    y = value,
    color = category,
    shape = category,
    size = category,
    alpha = category
  )) +
  geom_jitter(width = 0.2) +
  # Define styles for producer's samples versus all samples
  scale_alpha_manual(values = c(
    "Other fields" = 0.5,
    "Same crop" = 1,
    "Your fields" = 1
  )) +
  scale_color_manual(values = c(
    "Other fields" = "#CCC29C",
    "Same crop" = "#76ADBC",
    "Your fields" = "#A60F2D"
  )) +
  scale_size_manual(values = c(
    "Other fields" = 2,
    "Same crop" = 4,
    "Your fields" = 4
  )) +
  washi::washi_theme(
    legend_position = "bottom",
    gridline_x = FALSE,
    gridline_y = FALSE,
    text_scale = 1.5
  ) +
  theme(legend.title = element_blank(),
        axis.title.x = element_blank(),
        axis.title.y = element_blank(),
        panel.border = element_rect(color = "gray", fill = NA))

Make your reports self-contained

Provide your reader the context to understand the results.


Instead of ~300 lines of markdown:

## What We Measured in Your Soil

{{< include soil_health_measurements.qmd >}}


Includes shortcodes make it easy to reuse information across reports.

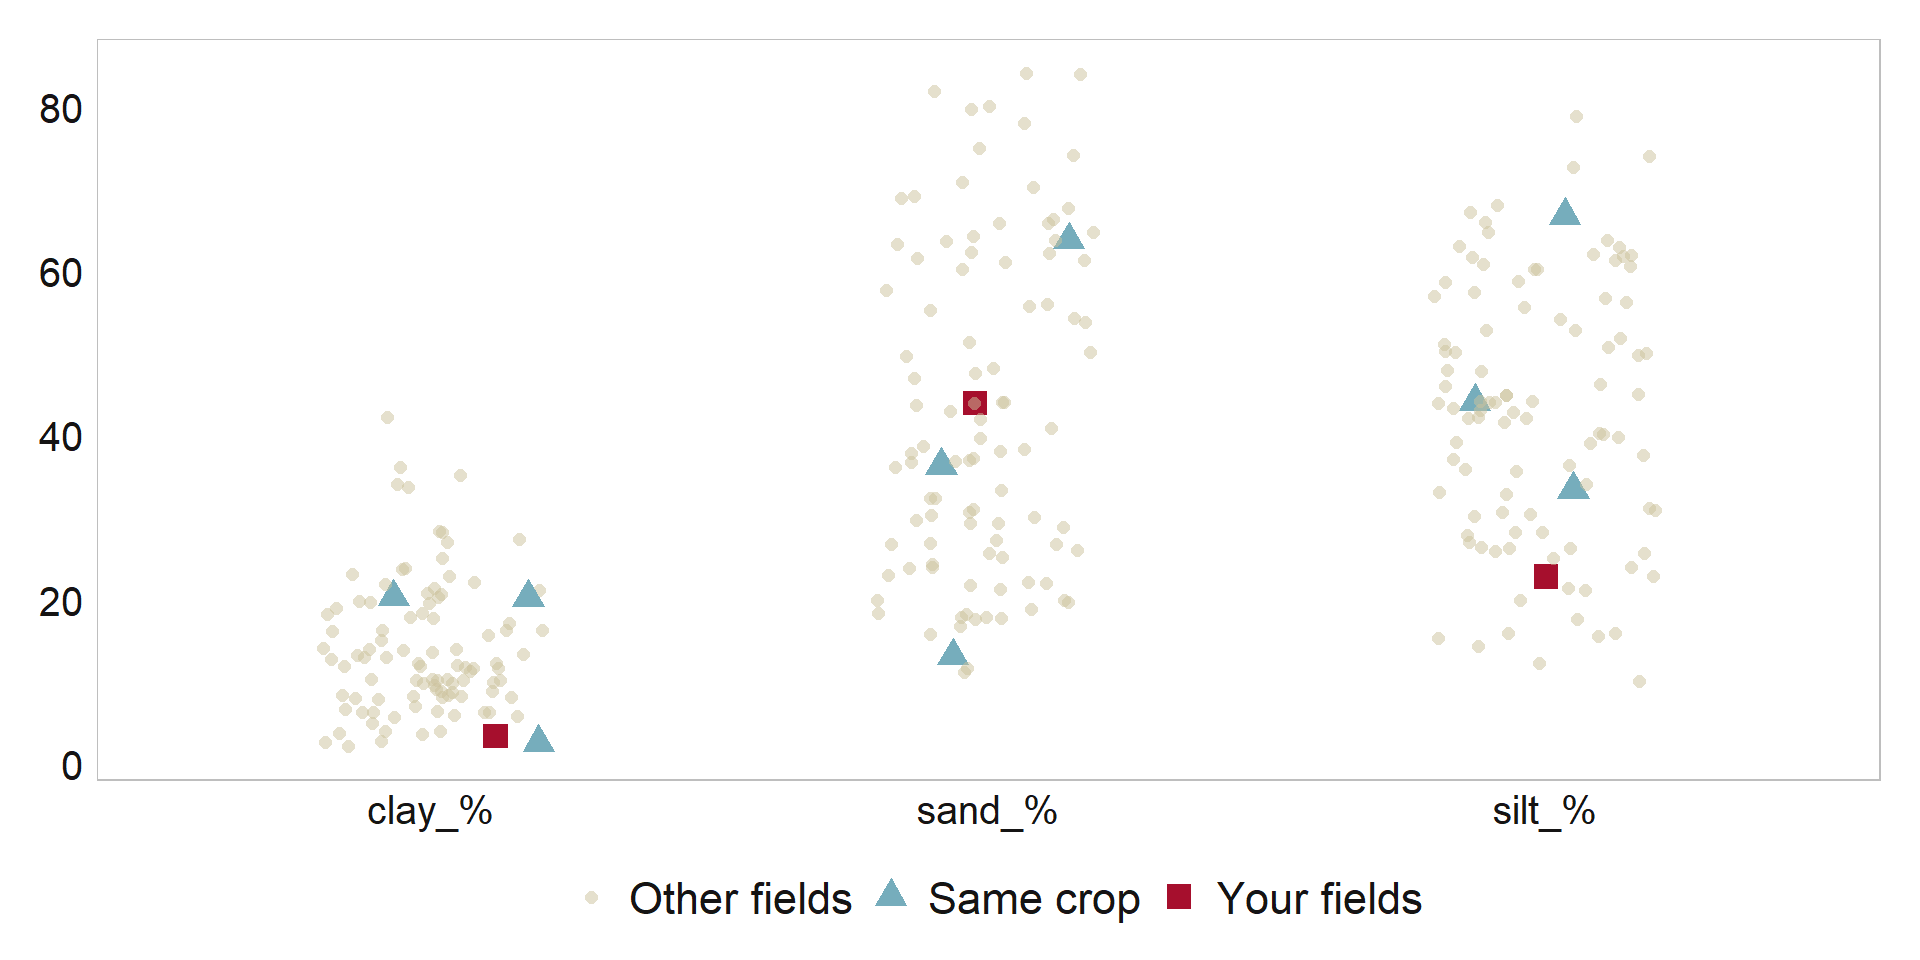
Make your HTML reports self-contained

# Include in YAML
---
format: 
  html:
    embed-resources: true
---

Otherwise, no one knows what to do with a _files folder of dependencies.

Be mindful of file size.

Cat on sinking Titanic meme.

— Step 4 —
Design for accessibility

Conditional markdown

:::: {.content-visible when-format="html"}
::: panel-tabset

Background on soil measurements.

:::
::::

Screenshot of soil measurement tabset in HTML report.

Conditional markdown

:::: {.content-visible unless-format="html"}

Background on soil measurements.

::::

Screenshot of soil measurements without tabset in MS Word report.

Conditional code evaluation

Evaluate plotly code only for HTML reports and regular ggplot2 code for anything else.


Get the output format type in your setup chunk:

```{r setup}
# Include in first chunk of .qmd
# Get output file type
out_type <- knitr::opts_knit$get("rmarkdown.pandoc.to")
```

Conditional code evaluation

Use out_type in eval chunk option.

Interactive plot for HTML reports:

```{r}
#| eval: !expr out_type == "html"

# code to create interactive {plotly}
```


Static plot for MS Word reports:

```{r}
#| eval: !expr out_type == "docx"

# code to create static {ggplot2}
```

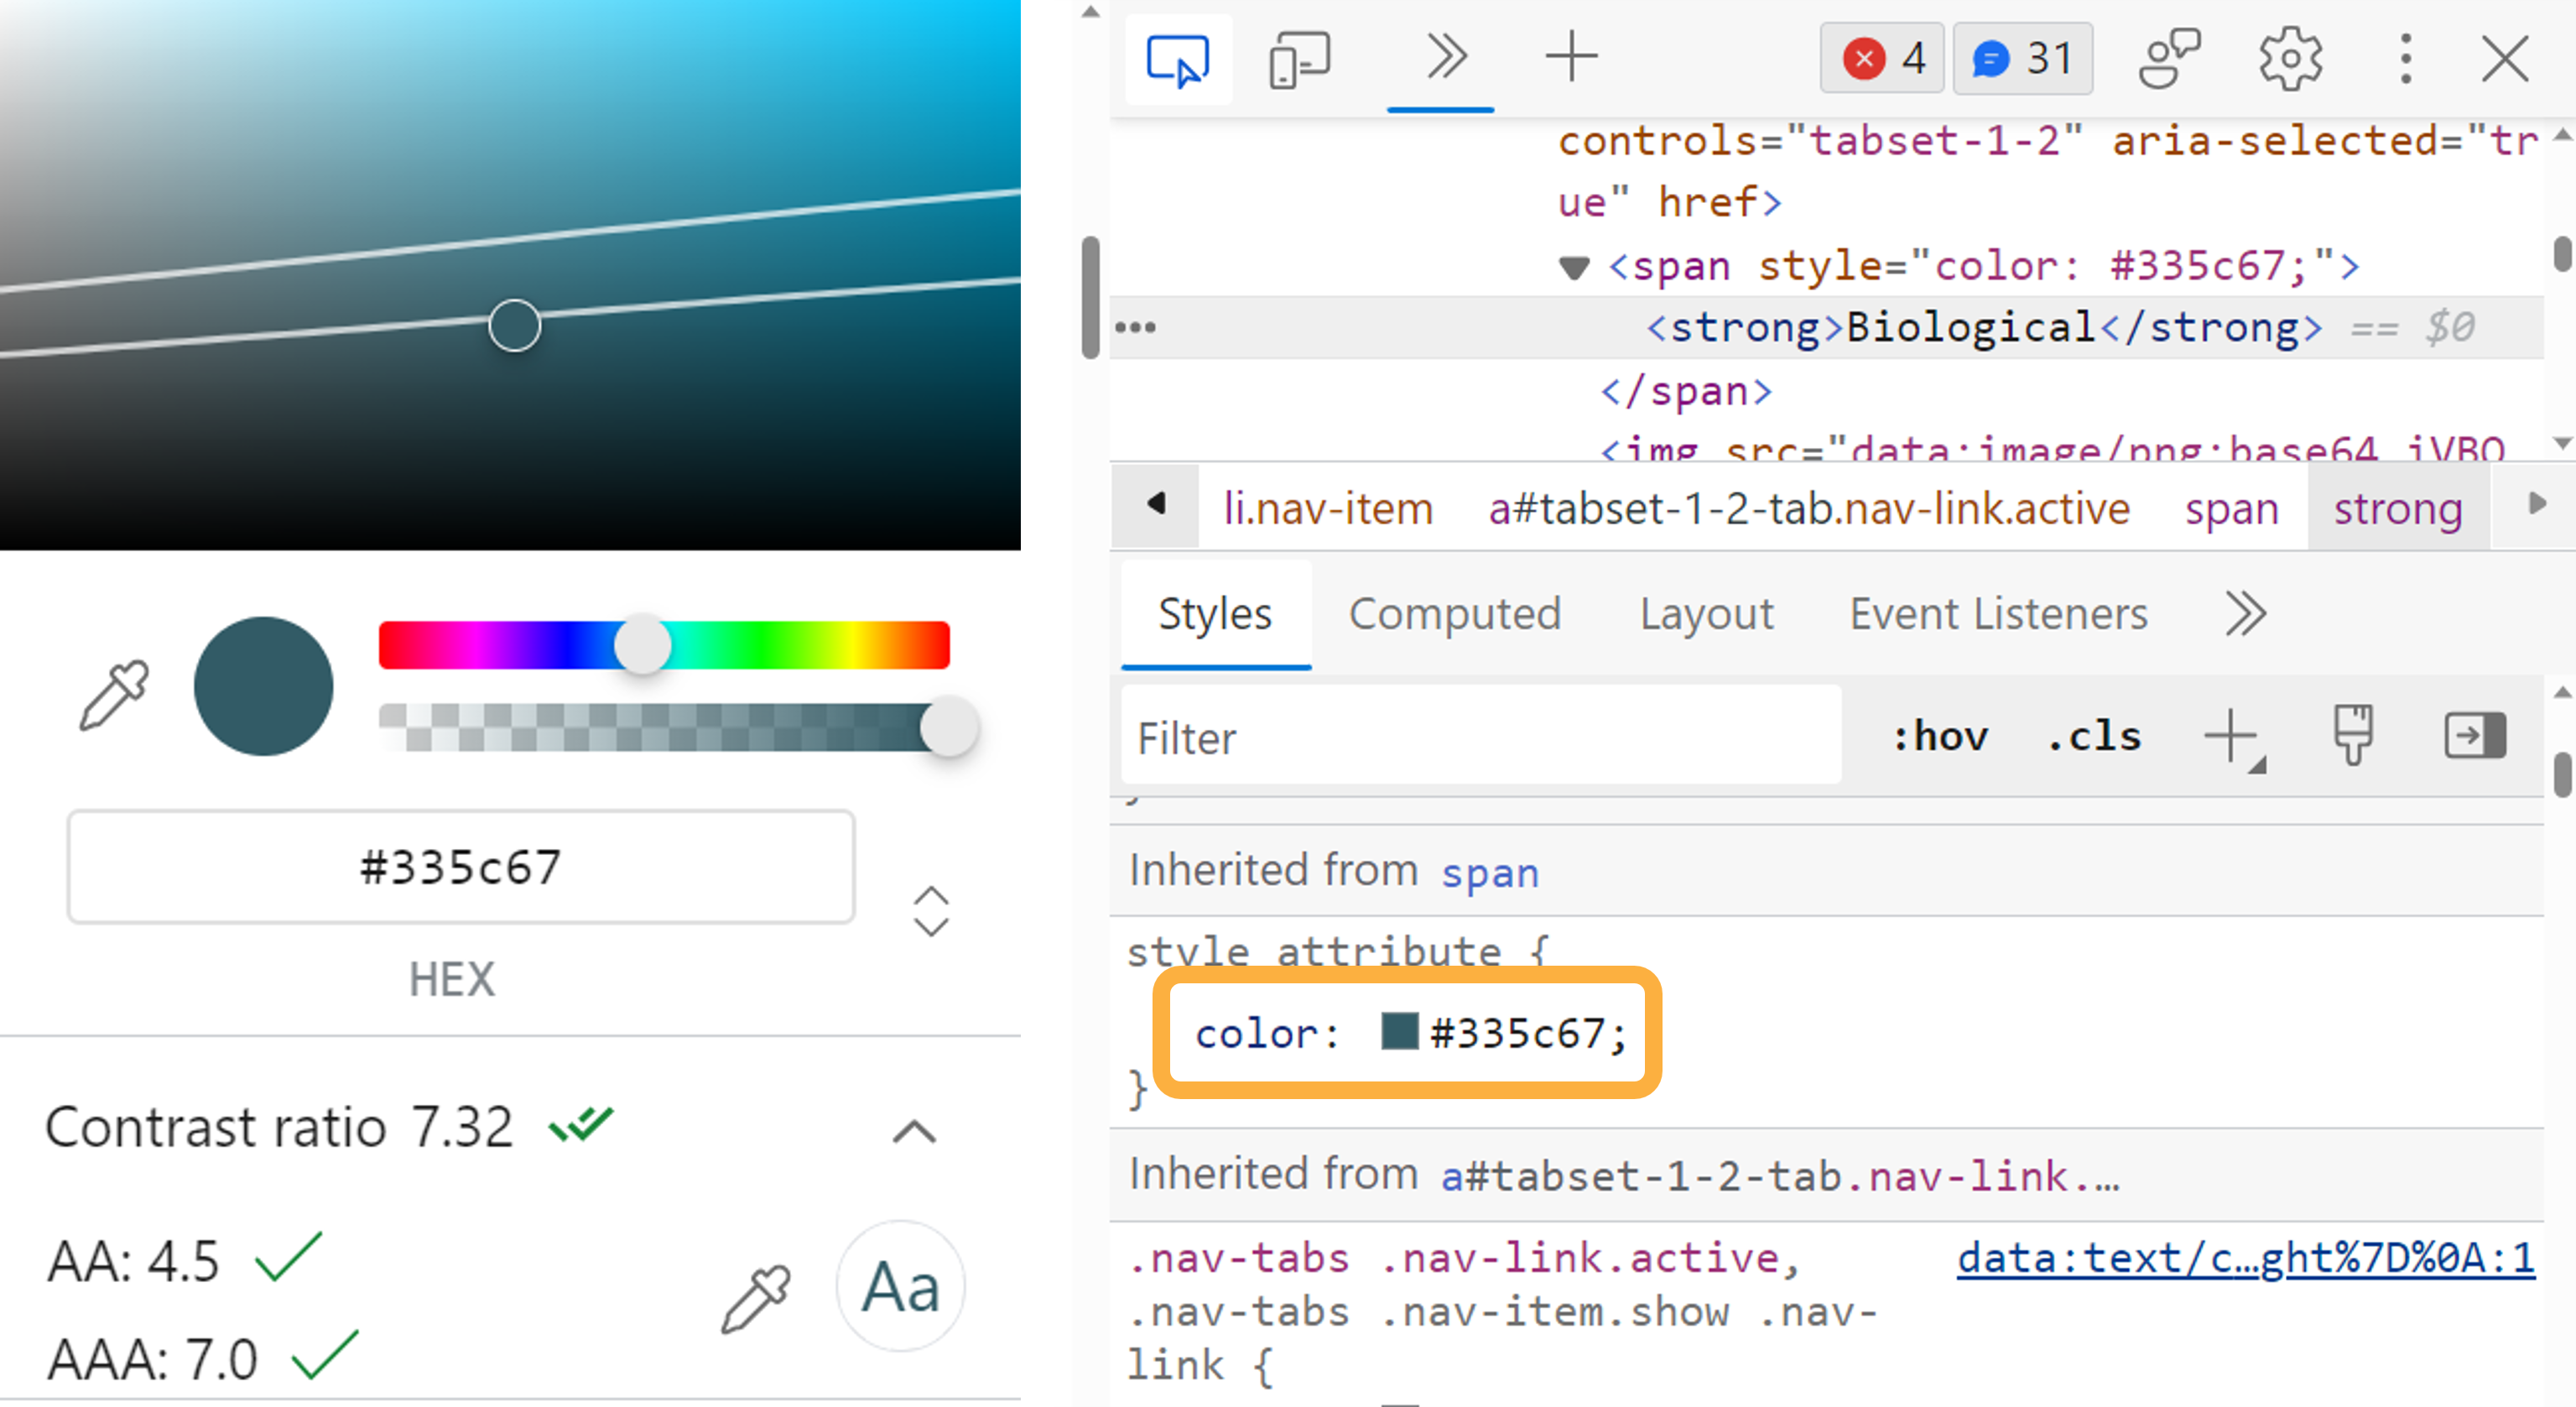
Style with font size and color contrast in mind

Use style sheets and templates

# Include in YAML header:
---
format:                                     
  html:                                     
    css: styles.css               # Style for HTML output
  word_document:                            
    reference_docx: styles.docx   # Style for MS Word output
---

Check HTML with browser developer tools

To get to developer tools: Right-click > Inspect > Ctrl + Shift + C > Hover over element. You can see contrast checker when hovering over any HTML element.

Check HTML with browser developer tools

Clicking on the color attribute in the inspector pane opens a dialog that allows you to see the contrast ratio and adjust the color to meet accessibility guidelines.

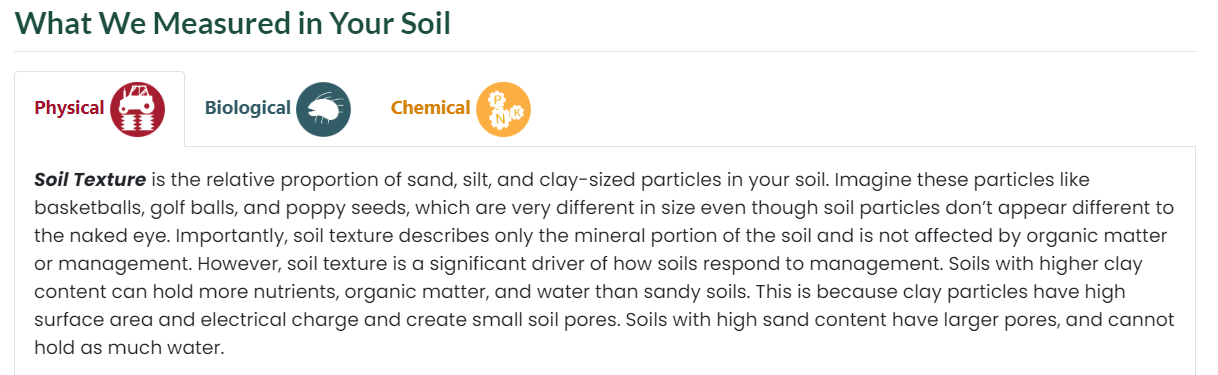
Everyone gets a custom decision-support tool!

Beginning of 2023 example HTML report

Check out an example HTML report.

Recap

Flow chart of workflow: Learn about parameterized reports, prepare subsettable data, create content for easy consumption, design for accessibility.

Cat falling asleep in human's lap with a phone with video playing on the sleepy cat's belly.

— Resources —

Quarto

Read about parameterized reports

Examples of parameterized reports

Videos about parameterized reports

Style sheets

Accessibility tools

Web Content Accessibility Guidelines (WCAG) Quick Reference

Check HTML reports with browser Inspect tool

I’d love to connect with you!

My three fave things: cats, nature, and R/Quarto.